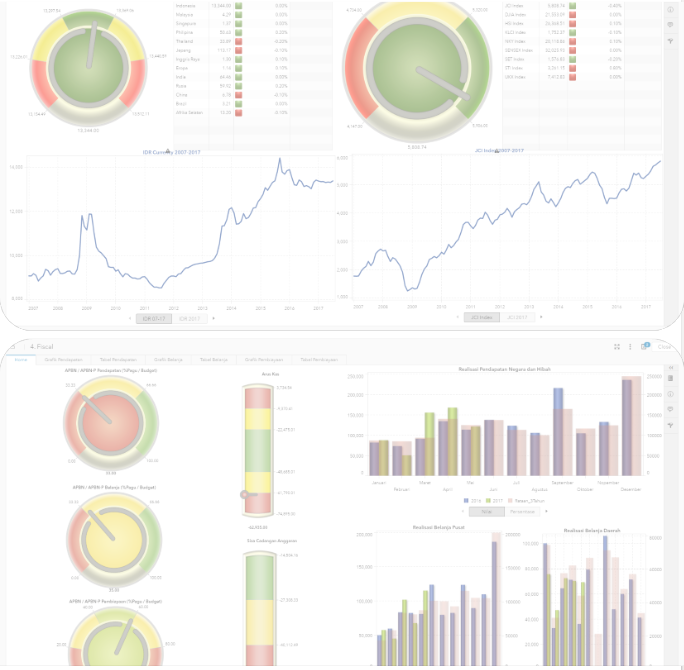
Encourage data-driven decision-making with an easily digestible dashboard to easily grasp comprehensive information.
Experience in:
- Tableau
- Microsoft Power BI
- SAS Visual Analytic

- MORA - Islamic Education Data Accuracy Audit 2020 - 2022
- MORA - Impact Evaluation of AKMI 2022
- MORA - Capacity Building, Communication, and Advocacy Service
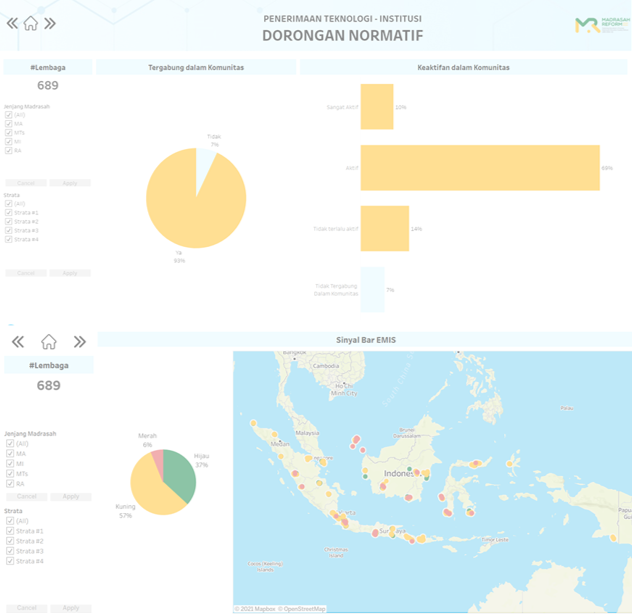
Realizing Education's Promise for Improved Quality of Education - Islamic Education Data Accuracy Audit 2020 - 2022, Nationwide, World Bank Loan No. 8992
To strengthen the data collection system as a basic for policymaking, the Ministry of Religious Affairs (Under REPMEQR Program) has released an updated data collection system called EMIS 4.0. The study is conducted to unpack the impact of EMIS 4.0 implementation by measuring the data accuracy of EMIS 4.0 database. Furthermore, the data accuracy will be used as the basis for policy-making to produce good quality data and increasing madrasah education services.
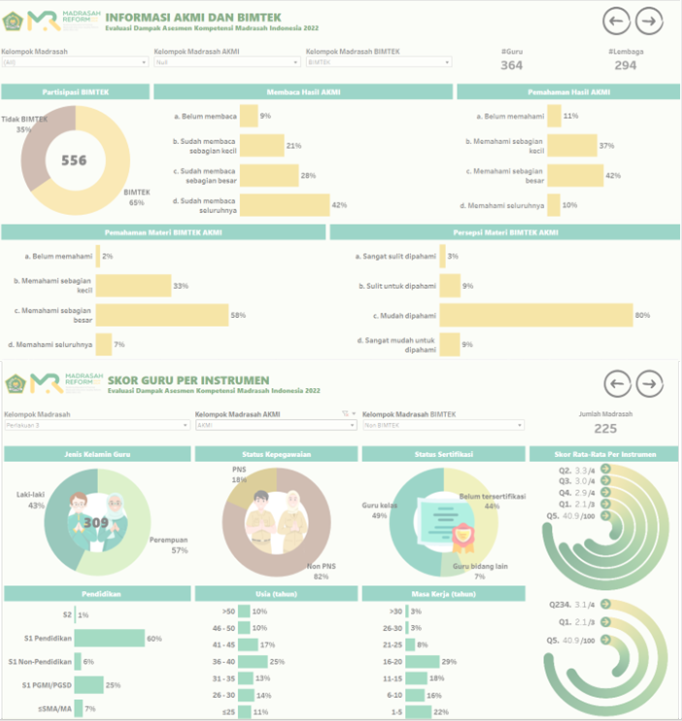
Realizing Education's Promise for Improved Quality of Education - Islamic Education Data Accuracy Audit 2020 - 2022, Nationwide, World Bank Loan No. 8992
The MoRA administers the Indonesian Madrasah Competency Assessment (AKMI), which measures the numeracy, reading, science, and sociocultural capabilities of all students at the MI, MTs, and MA levels. AKMI serves as both a benchmark for determining whether student capacities have been successfully developed through madrasah education and a guide for making the diagnosis for other educational system improvements. The result of this study is used as an assessment tool for refining the AKMI and BIMTEK implementation.
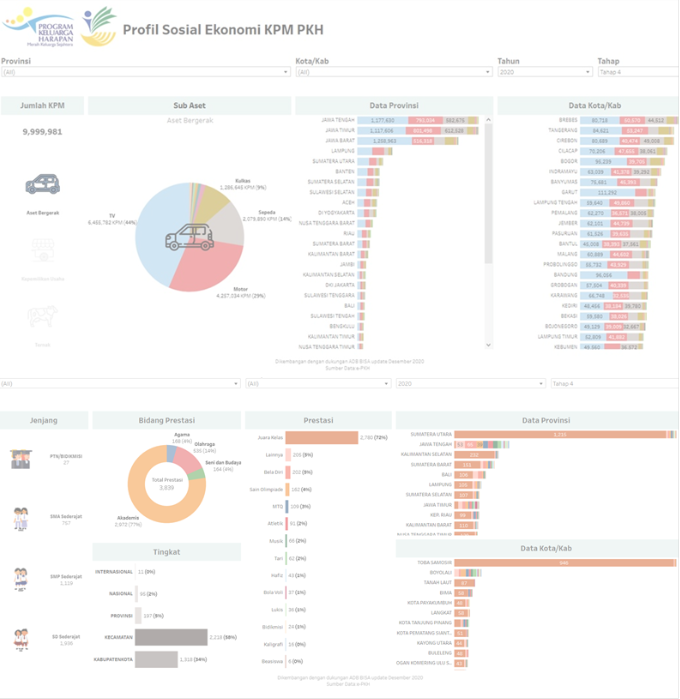
A3770 Building Inclusive Social Assistance Project – Capacity Building, Communication, and Advocacy Service, Nationwide, ADB Ref. POR007453
The Ministry of Social Affairs is implementing Program Keluarga Harapan (PKH), or Family Hope Programme. MOSA has to strengthen its implementation capacity by upgrading information technology systems, improving human resources management, ensuring adequate training of facilitators, and scaling up family development sessions to all PKH families. All data regarding PKH program is visualized in Tableau dashboard to easily digest which furthermore will be used to develop capacity-building plan and suggest improvements in the communication strategy.

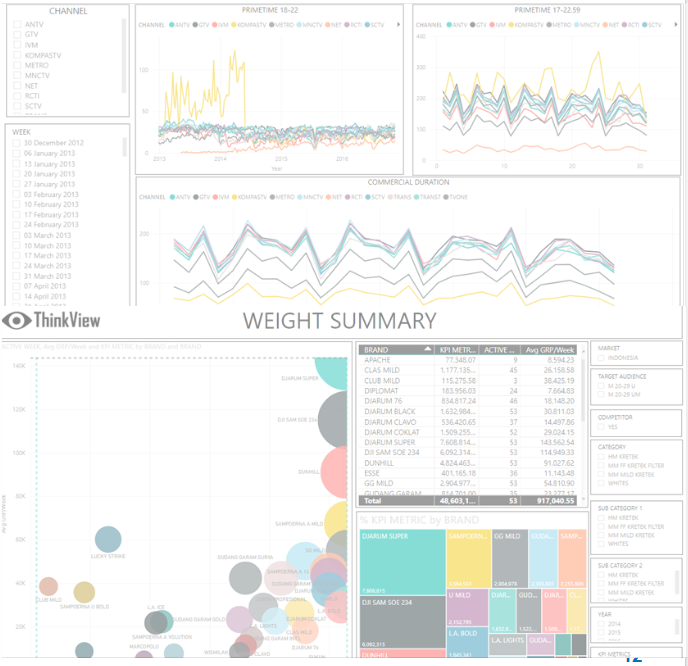
- ThinkView 2016
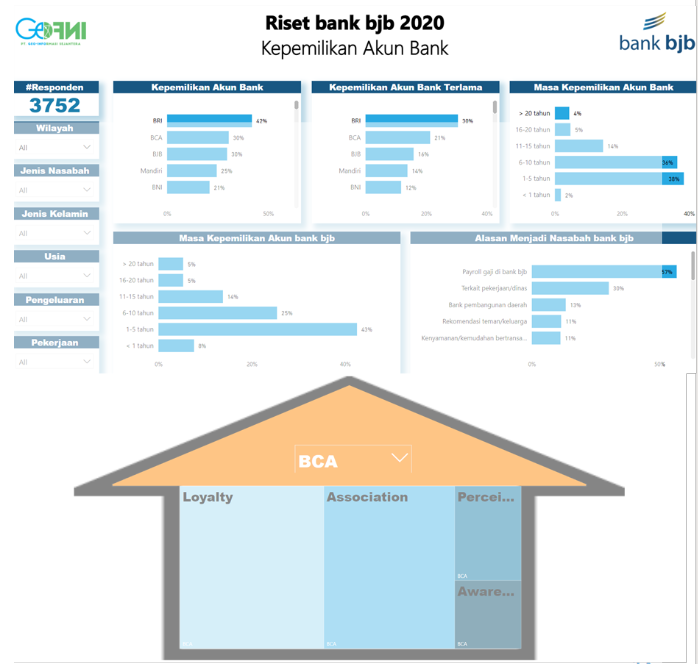
- Consumer Research bank bjb 2019-2020
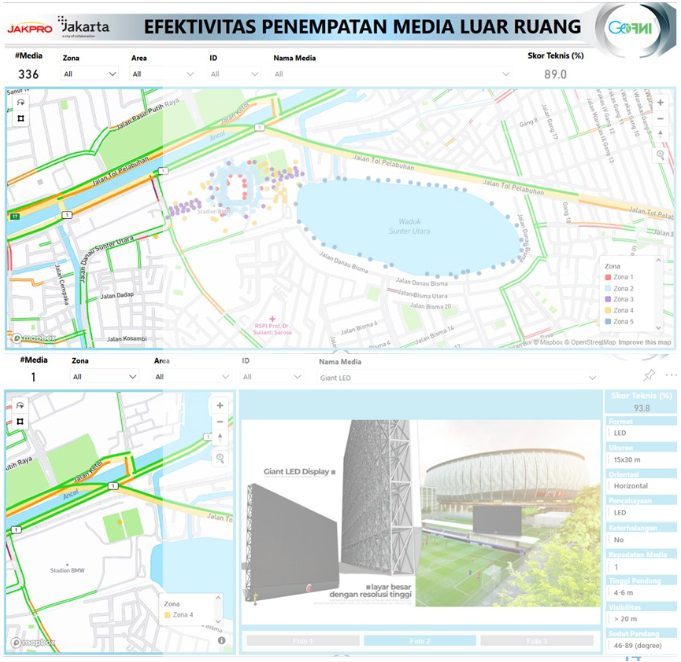
- Jakarta International Stadium – JIS 2020
- Jakarta International Velodrome – JIV 2021
ThinkView is an advertising dashboard to analyze output data from Nielsen Media Research from various types of advertising media in Indonesia.
This dashboard was developed by GeoINFO and used by various advertising agencies.
Consumer Research of bank bjb was a project that aimed to determine the brand equity of bank bjb and competitors from bank bjb customers and non-customers.
Consumer Research of bank bjb report was presented in BI tools in Power BI Format.
The project was carried out under the coordination of the Corporate Secretary of Bank BJB.
Jakarta International Stadium, as a strategic infrastructure project from JAKPRO, has potential income from outdoor advertising media that needs to be adequately explored.
In this study, all the potential spaces for advertising in outdoor media in the JIS area were explored in-depth, comprehensive, and realistic by considering various aspects.
The Project was carried out under the coordination of PT Jakarta Propertindo.
- Early Warning System Dashboard (2016)
The Early Warning System (EWS) Dashboard is an IT-based instrument to support activities at the Indonesian State Intelligence Agency (BIN), especially in producing fast, responsive, accurate, and credible economic policies.
The Project was carried out under the coordination of PT Jovan Karya Prakasa.
User-friendly interface
Power BI has a user-friendly interface, especially for people who are already familiar with the Microsoft environment. Power BI has impressive drag-and-drop features and self-service capabilities.
Ready to use visualization
There are various custom visualizations in Power BI which ready to use. In Tableau, users have to create custom visualization from the scratch and require extra effort to build it.
Tableau Costs More Than Power BI
Power BI has simple pricing, Power BI Pro with $10 per user/month and Power BI Premium with $10 per user/month. For Microsoft 365 subscribers, Power BI Pro is included in the subscription.
Tableau has complex pricing which depends on data needs and deployment options. There are three types of pricing for each deployment option. For Tableau Online Deployment, there are Tableau Creator with $70 per user/month, Tableau Explorer with $42 per user/month, and Tableau Viewer with $15 per user/month.


